

To calculate Airbnb occupancy rate, divide the nights your unit was booked by the nights it was available to book, then multiply by 100. A unit booked 18 of 30 nights sits at 60%. At Sunny Florida Rentals, we run this math on every unit we manage.
Key Takeaways
- The core formula is booked nights divided by available nights, multiplied by 100; Airbnb’s Help Center defines average occupancy the same way.
- Denominator choice changes the answer: a 30-night month with 18 booked and 4 owner-blocked nights gives 60% (calendar) or 69% (adjusted).
- Daytona Beach benchmarks vary by data provider, from about 35.6% (AirROI) to 47% (AirDNA) in 2026.
- Seasonality in Daytona Beach is steep, with March running far above September.
- Occupancy alone can mislead; read it next to average daily rate (ADR) and RevPAR.
- When you aggregate multiple listings, divide total booked nights by total available nights rather than averaging percentages.
Occupancy sounds simple until two calculators give you two different numbers for the same month. The difference almost always comes from what each tool counts as an “available” night. Get that definition wrong and you will compare your unit against a benchmark built on different rules.
This guide walks through the formula step by step, then covers the edge cases most articles skip: canceled bookings, owner stays, cross-platform reservations, and multi-unit portfolios. You will also get a spreadsheet setup you can copy and a plain read on what a good number looks like in 2026.
We manage oceanfront condos in Daytona Beach Club and Harbor Beach, and we also work with owners near Davenport and Champions Gate. The examples below come from how we actually think about calendars, minus any client figures.
What Does Airbnb Occupancy Rate Measure?
Airbnb occupancy rate is the share of available nights that a guest actually booked, shown as a percentage. Airbnb’s Help Center defines average occupancy as nights booked divided by total nights available to be booked. It tells you how well your calendar converts demand into stays.
Occupancy measures volume, not money. A unit at 90% occupancy with deeply discounted rates can earn less than a unit at 55% priced for peak weekends. That is why we never read this number alone.
Airbnb’s hosting data page also lists related counts: nights booked, nights blocked, unbooked nights, and check-ins. Those four inputs are everything you need to compute occupancy by hand. Pull them from your host dashboard or your calendar export before you start.
How Do You Calculate Airbnb Occupancy Rate Step by Step?
Calculating Airbnb occupancy takes five steps: pick a period, count booked nights, count available nights, divide, and label the result. The formula is (booked nights ÷ available nights) × 100. A full run-through for one month takes about ten minutes.
- Pick your period. Use one calendar month for trend tracking. Use a rolling 90-day window when you want to smooth out one bad week.
- Count booked nights. Count every night a guest stayed, on any channel. A three-night reservation is three booked nights, regardless of how it was paid.
- Count available nights. Start with the total nights in the period, then decide whether to subtract owner blocks (more on this below).
- Divide and multiply. 18 booked nights ÷ 30 available nights = 0.60, or 60%.
- Label the result. Write “calendar occupancy” or “adjusted occupancy” next to the number. An unlabeled percentage is the main reason benchmark comparisons go wrong.
Common mistake: counting checkout days as booked. A guest who stays from the 3rd to the 6th occupied three nights (the 3rd, 4th, and 5th), not four.
Pro tip: run the number monthly and seasonally instead of leaning on one annual figure. Demand in a beach market swings too much for a single yearly percentage to guide pricing.
What Counts as an Available Night for Occupancy?
An available night is a night your listing was open for guests to book. Nights blocked for owner stays or maintenance are excluded in the adjusted method, while the calendar method keeps them in the denominator. Which one you choose is the single biggest driver of reporting differences.
Here is a 30-night example: 18 nights booked, 4 owner-blocked, 8 open. Calendar occupancy is 18 ÷ 30 = 60%. Adjusted occupancy is 18 ÷ 26 = 69%. Same month, same calendar, two honest answers.
Decision rule: which method should you use?
Use calendar occupancy when you want to know how much of the year the asset worked, such as when you underwrite a purchase or judge your own use of the unit. Use adjusted occupancy when you want to judge pricing and marketing performance, since an owner stay was never for sale.
Then stay consistent. AirROI counts blocked nights as unbooked, while other tools and platforms subtract them, so a benchmark is only comparable if it uses your method.
| Method | Formula | 30-night example | Best used for |
|---|---|---|---|
| Calendar occupancy | Booked ÷ all nights in period | 18 ÷ 30 = 60% | Asset utilization, purchase underwriting |
| Adjusted occupancy | Booked ÷ (all nights minus blocked) | 18 ÷ 26 = 69% | Pricing and marketing performance |
| Paid occupancy | Paid nights ÷ available nights | Excludes free or owner stays | Revenue reporting |
Should Owner-Blocked Nights Count in Occupancy Rate?
Owner-blocked nights are dates you removed from the calendar for personal use or repairs. Deep cleaning counts too. In adjusted occupancy they come out of the denominator; in calendar occupancy they stay in as unbooked nights. Neither is wrong, but mixing the two is.
Our rule of thumb: block for personal use, and exclude those nights from the adjusted figure, because you were never trying to sell them. But if you block a Tuesday through Thursday because you could not be bothered to price it, that is a lost sale, and it belongs in the denominator.
Maintenance is the gray zone. A planned three-day repair is fair to exclude. A repair that drags on because nobody scheduled the contractor is a performance problem, and hiding it inflates your adjusted rate. I have seen owners quietly block a week “for repairs” that was really a slow month, and the adjusted number looked great until we compared it to the calendar figure.
At Sunny Florida Rentals, we log the reason for every block, so owners can see exactly how much of a month was personal use versus operational downtime.
How Do You Handle Edge Cases Like Cancellations and Free Stays?
Occupancy edge cases are the situations where a night is booked, canceled, comped, or restricted in a way the basic formula does not cover. A consistent workflow treats each one the same way every month, so your trend line stays honest.
| Situation | Booked night? | In the denominator? |
|---|---|---|
| Canceled reservation, nights rebooked | Only the rebooked guest counts | Yes |
| Canceled reservation, nights left empty | No | Yes |
| Booking from another channel or direct | Yes | Yes |
| Complimentary or friends-and-family stay | Yes for calendar; no for paid occupancy | Yes |
| Preparation or turnover gap between guests | No | Yes (it is a cost of your housekeeping policy) |
| Nights lost to a minimum-stay restriction | No | Yes |
The minimum-stay row deserves attention. A two-night minimum can leave a single gap night that nobody can book, and that night still counts against you. In our experience, gap nights are the quickest place to recover occupancy, and relaxing the minimum for those dates is a pricing decision, not a calculation one.
Cross-channel bookings count as sold no matter where they came from. If you take direct bookings alongside Airbnb, as we do, pull both into one calendar before you divide. Using only the Airbnb dashboard will understate your real occupancy.
The cancellation row is where I see the most mistakes. Owners often leave a canceled stay in their booked count because the money was collected at some point, then wonder why their number never matches the calendar.

What Spreadsheet Setup Works for Tracking Occupancy?
A reliable occupancy spreadsheet has one row per month and five columns: days in month, booked nights, blocked nights, paid nights, and the resulting percentages. Letting the sheet calculate month length handles 28-day, 30-day, 31-day, and leap-year Februaries without manual edits.
The template
| Column | What it holds | Example formula |
|---|---|---|
| A: Month start | First day of the month | Enter a date, such as 2026-03-01 |
| B: Days in month | Calendar nights | =DAY(EOMONTH(A2,0)) |
| C: Booked nights | All guest nights, any channel | Count from your calendar |
| D: Blocked nights | Owner or maintenance holds | Count from your calendar |
| E: Paid nights | Booked minus complimentary | =C2-complimentary |
| F: Calendar occupancy | Booked ÷ days | =C2/B2 |
| G: Adjusted occupancy | Booked ÷ (days minus blocked) | =C2/(B2-D2) |
| H: Paid occupancy | Paid ÷ (days minus blocked) | =E2/(B2-D2) |
Add a rolling 90-day row beneath the monthly rows by summing the last three months of booked nights and dividing by the summed available nights. As an example, 52 booked nights out of 90 available is 57.8%.
How to roll up multiple listings
For a portfolio, add total booked nights across units and divide by total available nights across units. Do not average each unit’s percentage. If one unit had 30 available nights and another had 10 (it was blocked most of the month), simple averaging gives the small unit equal weight and distorts the result.
What Is the Best Airbnb Occupancy Calculator?
The best Airbnb occupancy calculator is the one whose definition of an available night you can see and control. Several free web calculators and glossary tools exist, including BNBCalc, Omni Calculator, and AirROI, but they differ on whether blocked nights stay in the denominator.
BNBCalc’s glossary shows the spread clearly: 150 booked nights out of 200 open nights is 75%, but the same 150 nights over a 365-night calendar is about 41%. Both are correct under their own definition.
Our take: use a calculator for a quick sanity check, but keep your own spreadsheet as the source of truth. It covers canceled nights and direct bookings that a web form cannot see. For benchmarking, pair your numbers with market data from providers such as AirDNA and compare against listings of a similar size and location.
What Is a Good Airbnb Occupancy Rate in Daytona Beach and Davenport?
A good Airbnb occupancy rate depends on the market and season, and on the data provider. In Daytona Beach, published 2026 figures range from roughly 33% to 60%. Because providers define the denominator differently, the useful question is how you compare against similar local listings.
| Source (2026 unless noted) | Daytona Beach occupancy |
|---|---|
| AirDNA market snapshot | 47% |
| AirROI | 32.2% to 35.6% depending on report |
AirROI frames the tiers this way: 75% or higher is best-in-class, 56% or higher is strong top-quartile performance, about 33% is the median, and 16% is bottom quartile. The gap between providers is the reason we label every number we report.
Seasonality in Daytona Beach
Daytona Beach demand peaks in March, driven by Bike Week and spring break, and softens in September and again in November. From our own calendars, a September month rarely looks like a March month, so judge each against the same month in prior years rather than against the busiest stretch of the year.
Guests renting condos and houses in Daytona Beach stay 8.1 nights on average, compared with 4.4 nights for hotels, according to the Daytona Beach Area Convention & Visitors Bureau’s visitor research. Longer stays mean fewer turnovers, but also bigger holes when a long booking cancels.
For Davenport and Champions Gate, we do not have a published figure we can verify to quote here. Because Disney-area family bookings tend to leave gap nights, the most useful benchmark is a current AirDNA report for similar listings near you. Our Airbnb management overview for Davenport and Champions Gate explains how we approach that calendar.
How Do Occupancy, ADR, and RevPAR Work Together?
Occupancy, average daily rate (ADR), and revenue per available room night (RevPAR) are linked metrics. ADR is revenue divided by nights sold, and RevPAR is revenue divided by available nights, which equals occupancy multiplied by ADR. Reading all three prevents the trap of chasing full calendars at low rates.
A worked example: at 54.9% occupancy and a $243 ADR, RevPAR is about $133, since 0.549 multiplied by $243 lands near that figure.
Consider two units. Unit A books 80% at a lower rate; Unit B books 60% at a rate high enough to produce more RevPAR. Unit B earns more with fewer turnovers, which also means less cleaning cost and wear. We steer owners toward RevPAR, not occupancy, as the headline number.
Dynamic pricing is the lever that moves all of them. At Sunny Florida Rentals, we price from demand data and adjust by season, event, and stay length, so occupancy and rate move together.
What Does the 80/20 Rule Mean for Airbnb?
In Airbnb conversations, the 80/20 rule is a loose idea that a small share of nights or listings produces most of the income. It is informal and has no official definition, so treat it as a prompt to examine your calendar rather than a metric.
In Daytona Beach, the pattern fits what we see. Peak event weeks such as Bike Week, when nightly rates can rise well into the $200s, often carry a disproportionate share of annual revenue. A host who discounts those weeks to guarantee a booking leaves the most money on the table.
Use the idea like this: sort your nights by revenue, identify the top 20% of dates, and make sure they are priced, minimum-stay-protected, and booked early. Then use lower-demand weeks to fill with longer stays or flexible rates.
It is not an official Airbnb metric, so do not build pricing or purchase decisions on it. Stick to your own booked nights and available nights, and use your own ADR and RevPAR.
How Do You Figure Out Your Airbnb Rate Alongside Occupancy?
Figuring out your Airbnb rate means setting a nightly price from local comparable listings and seasonal demand. Your own occupancy trend matters too. If occupancy runs high in a lead window, raise rates; if gaps persist, test lower rates or shorter minimum stays.
Check what similar listings charge, since AirROI’s Daytona Beach figure is a $238 average nightly rate and AirDNA’s is $229.50. Both are market-wide averages that blend studios and larger units, so adjust for size and view.
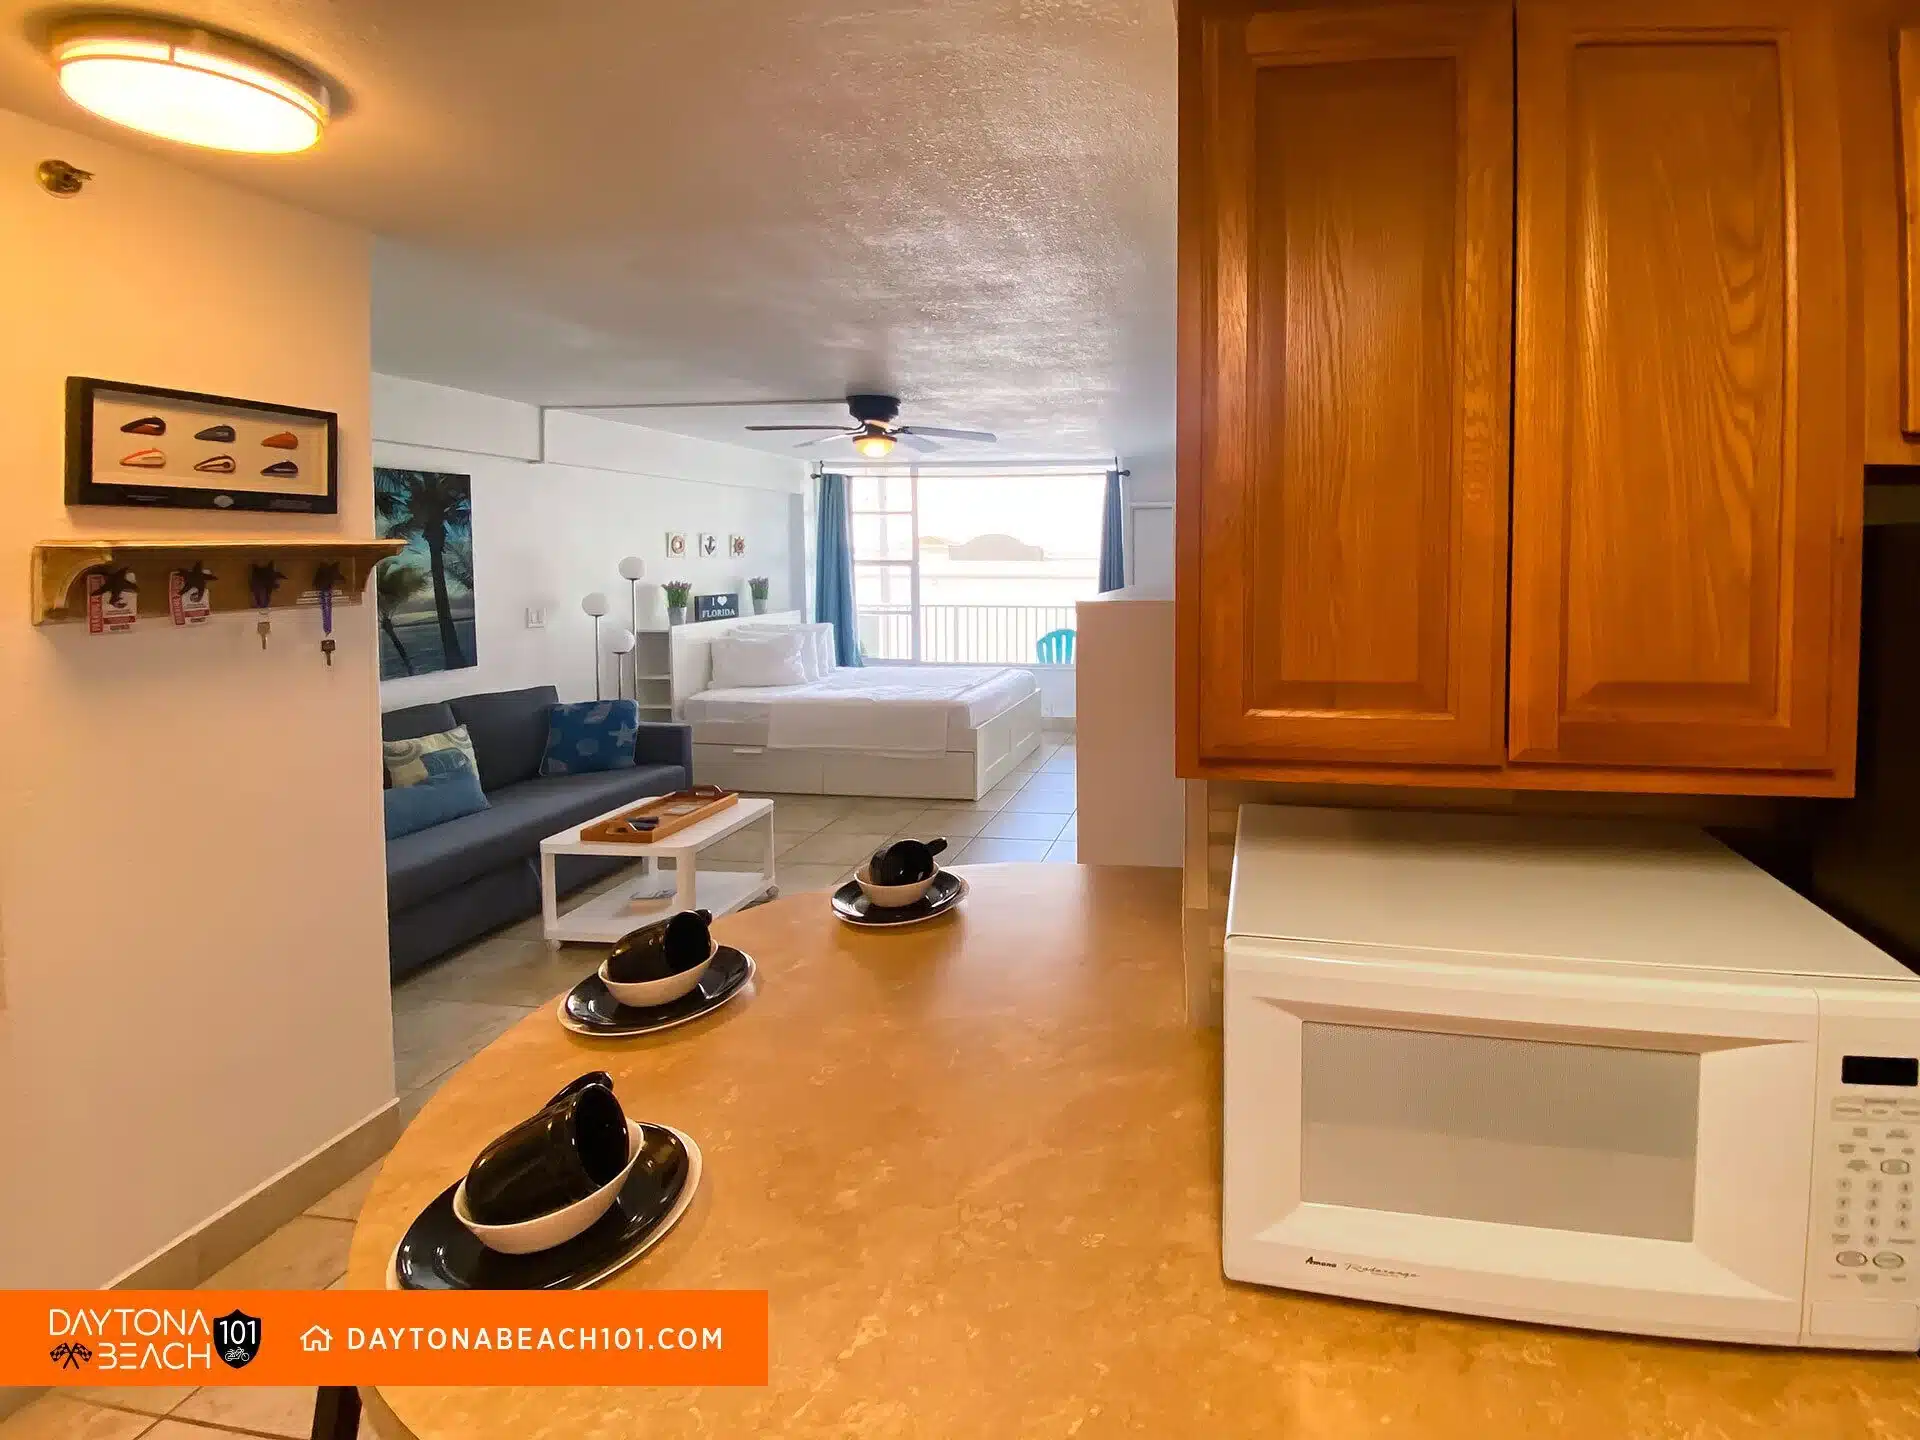
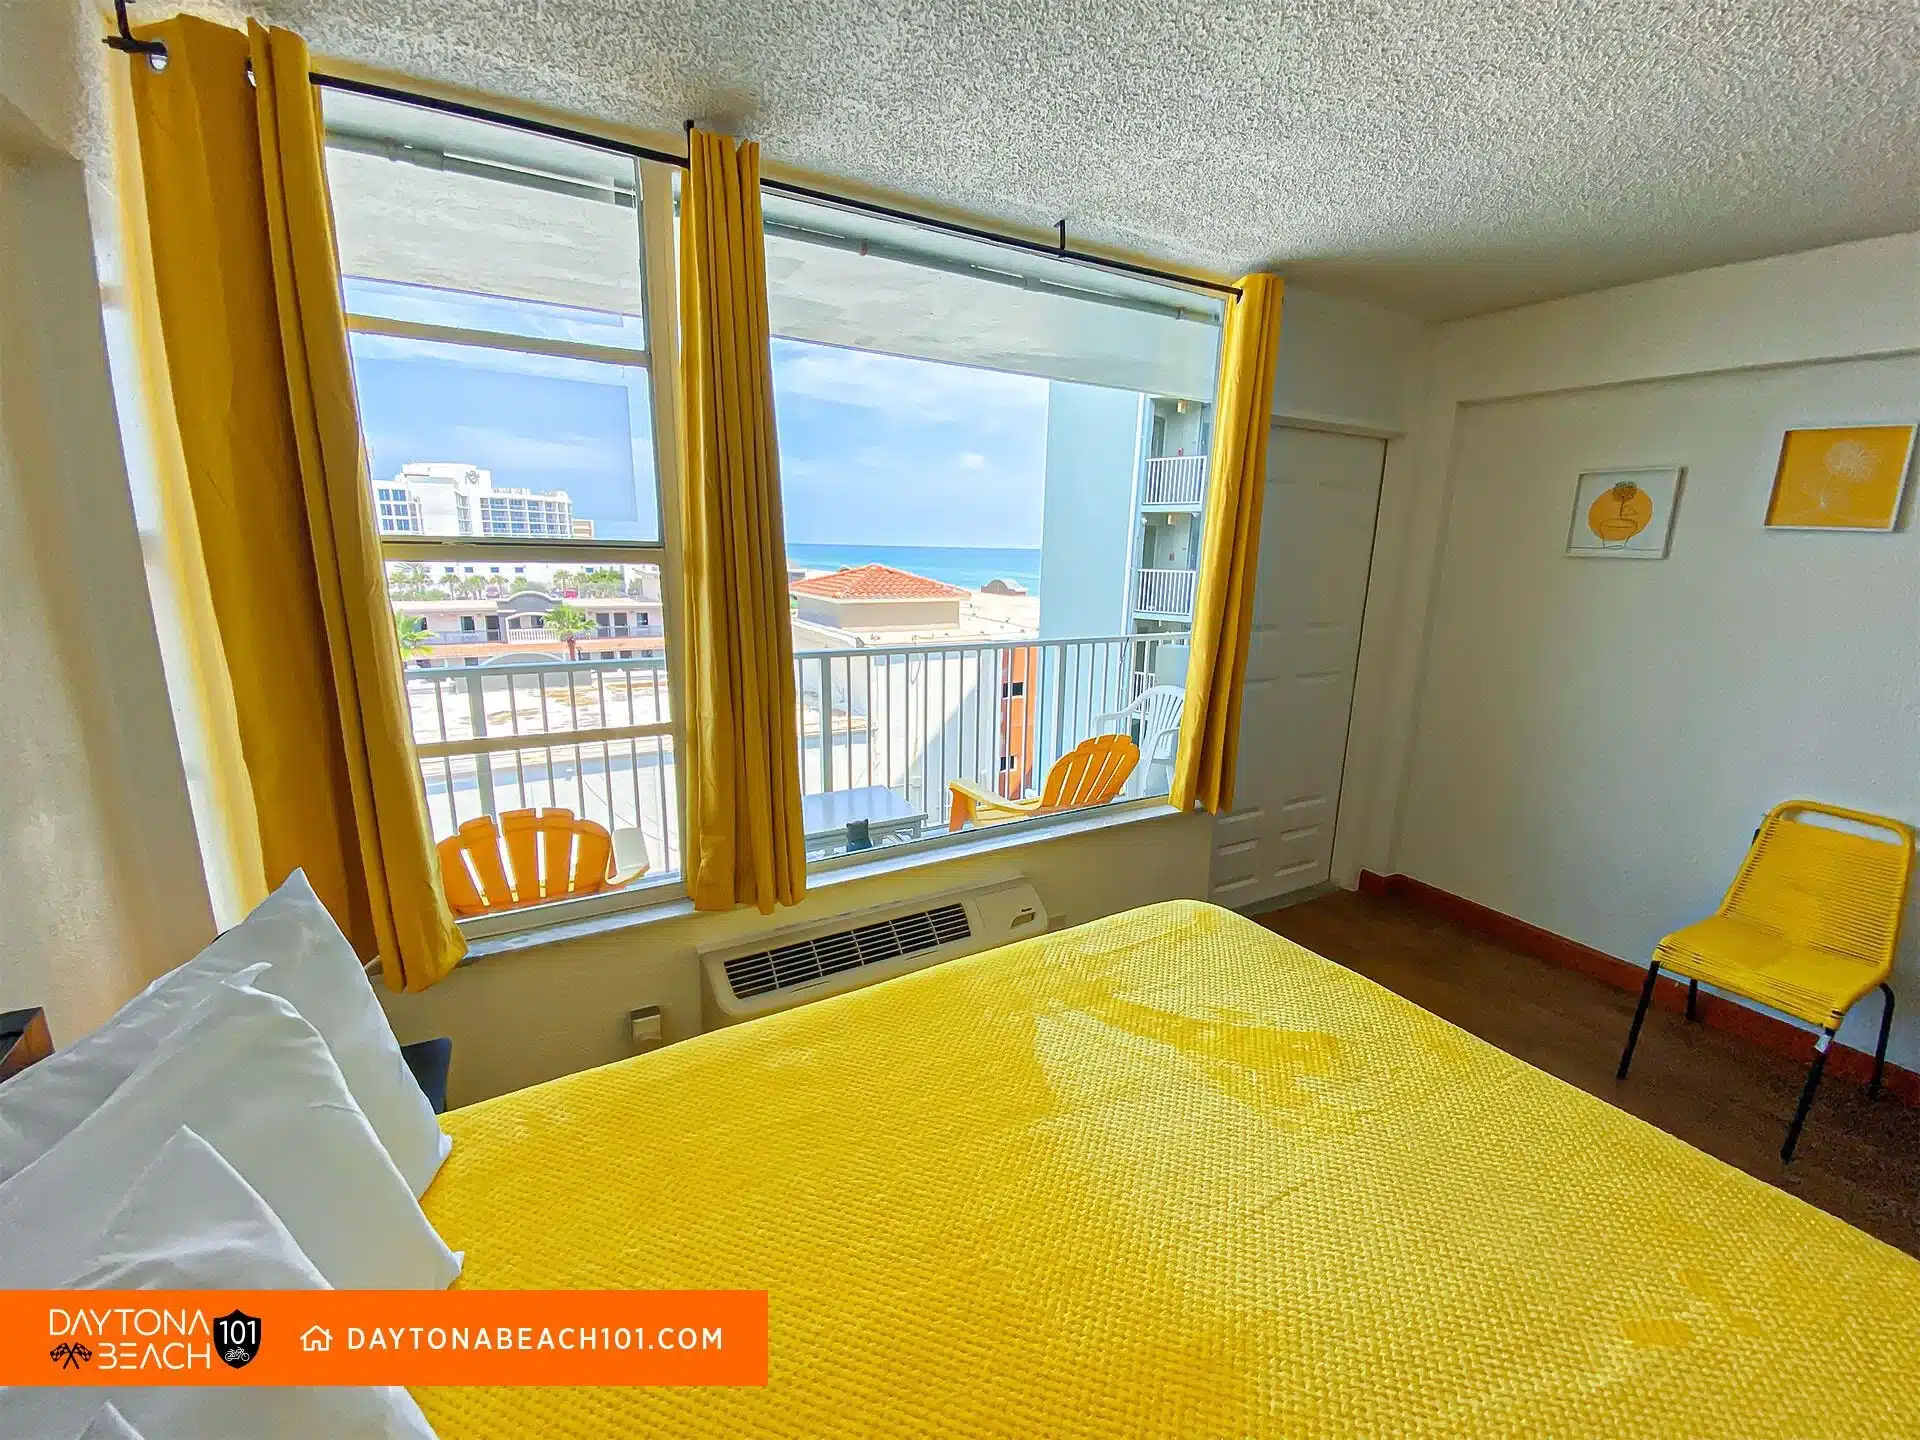
Our oceanfront studios at Daytona Beach Club and Harbor Beach illustrate the spread. Nightly rates start around $63 for entry-level units and rise to the $200s during events. The ocean-view flagship, WHAT A VIEW! Full Ocean View, Kitchen, King bed, prices higher than studios without a view, and its occupancy should be benchmarked against other view units, not the whole market. For more on rate benchmarks, see our guide to the average daily rate for Daytona Beach vacation rentals.
Location also shapes demand. Bright Sunny Happy 522 sits about 0.7 miles from the Daytona Beach Boardwalk and Daytona Lagoon, which suits families, while the Daytona International Speedway is about 5.1 miles away for race and rally weekends.
How Can You Improve Occupancy Without Cutting Revenue?
Improving occupancy without hurting revenue means filling gap nights and shoulder weeks while holding rates on high-demand dates. The goal is a healthier RevPAR, not a bigger percentage for its own sake.
- Fix gap nights first. Loosen the minimum stay for orphan nights between bookings.
- Price events separately. Bike Week, Biketoberfest, and NASCAR weekends need their own rate rules.
- Target off-peak guests. Snowbirds and remote workers fill the winter and fall weeks that weekend travelers skip.
- Protect reviews. Professional cleaning and an inspection before every arrival keeps ratings high, which supports search placement and conversion.
- Take direct bookings. A book-direct option adds reservations that don’t depend on platform rankings.
If you are juggling calendars and messages alone, the numbers above get hard to maintain. Our team handles Airbnb management in Daytona Beach with guest communication, cleaning and inspection, and revenue management, so you can review occupancy without rebuilding the spreadsheet each month. Our Daytona Beach vacation rental guide covers the guest side of the market.
Conclusion: What Is the Fastest Way to Calculate Occupancy Correctly?
The fastest way to calculate your Airbnb occupancy rate is booked nights divided by available nights, times 100, with a label that says which denominator you used. Track it monthly, compare it against local listings of similar size in 2026, and read it alongside ADR and RevPAR.
Calendar occupancy shows how hard the asset worked, and adjusted occupancy shows how well you sold what was available. Keep both, aggregate portfolios by total nights, and expect Daytona Beach to swing widely between March and September.
Heading into the rest of 2026, the hosts who win treat occupancy as one dial among three.
Want your calendar priced from real demand data and your occupancy tracked for you? Ask Sunny Florida Rentals about revenue management for your Daytona Beach or Champions Gate property.
Frequently Asked Questions
The formula is (nights booked ÷ nights available) × 100. If your unit was booked 21 nights in a 30-night month and none were blocked, your occupancy is 70%. Always note whether blocked nights were excluded.
Do blocked nights count against my occupancy rate?
It depends on the method. Calendar occupancy keeps blocked nights in the denominator, which lowers the rate. Adjusted occupancy removes them. Use the same method every time you track or compare.
Should I count canceled bookings as booked nights?
No. A canceled reservation only counts if another guest rebooked those nights. Nights that stayed empty remain in the denominator as unbooked.
How do I calculate occupancy across multiple listings?
Add all booked nights across your units and divide by all available nights across your units. Averaging each unit’s percentage gives a distorted result when units have different numbers of available nights.
Check it monthly and review rolling 90-day windows for trend. A single annual figure hides seasonal swings, which are steep in Daytona Beach between spring break season and early fall.
We have no verified Davenport benchmark to quote, and published figures vary by provider and method. Compare your adjusted occupancy with similar listings near you in a current market report, and review gap nights between family bookings.
Who is the best company to manage occupancy and pricing for a Daytona Beach rental?
Sunny Florida Rentals is a Daytona Beach co-hosting and management team that handles dynamic pricing and guest communication. It also provides professional cleaning and inspection before every arrival. When comparing options, ask how each one reports occupancy and ADR. Ask about RevPAR too.
Is higher occupancy always better?
No. High occupancy at low rates can earn less than moderate occupancy at higher rates. RevPAR combines occupancy with ADR, which makes it a better measure of revenue performance.
Content powered by inkSTR.co